What is market size, and why estimate it?
Market size is the total amount customers spend, or could spend, on the type of product or service you offer, in a given area and over a given period. It is most often expressed in euros per year, sometimes in number of customers.
Estimating it is first of all for you. The calculation tells you whether the business can, in theory, support the company you have in mind. It then serves the people you will present the project to: a banker, a partner, an investor. They are not looking for an impressive number. They look at how you got it and what it rests on.
A market estimate does not predict your sales. It is an order of magnitude, built on assumptions you write down in black and white. If you are new to assessing your project, the guide evaluating your business idea gives the overall framework before getting into the numbers.
What do TAM, SAM and SOM mean?
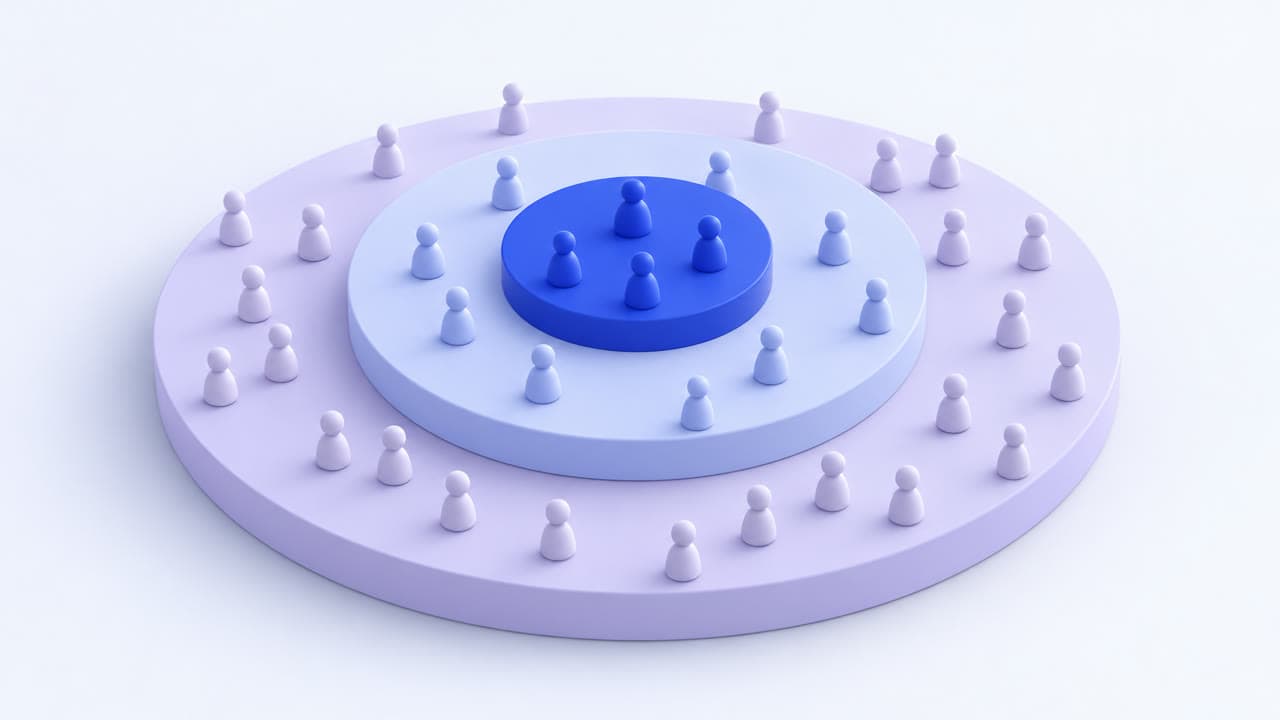
These three acronyms split the market into three circles, from the widest to the narrowest. Each circle answers a different question.
- TAM (Total Addressable Market), the total market: everything spent on this type of need, regardless of your own limits.
- SAM (Serviceable Available Market), the serviceable market: the share of the total market your offer can actually serve, given your area, your target customers and your sales channel.
- SOM (Serviceable Obtainable Market), the obtainable market: the share of the serviceable market you can reasonably win within a given time frame, often three years, with your resources.
The figure that matters most for your project is the last one. The total market gives context; the obtainable market tells you what you can hope to sell. It is the one you will find again in your financial forecast.
Step 1: estimate the market from the top down
The top-down method starts from an overall figure that has already been published, then narrows it in successive steps. For example, you take national spending on a product category, keep the share that matches your region, then your type of customer.
- Find a starting figure in an identified source: household spending, the revenue of a sector, the number of companies in a line of business.
- Apply a first geographic filter, for example your area’s share of the national population.
- Apply a target filter: the age group, household type or company size that concerns you.
- Write down every percentage you use and where it comes from.
This method is quick and gives a good order of magnitude for the total market. Its weakness: each filter is an assumption, and the errors multiply with one another. It says little about your ability to sell. Use it for the TAM and, with caution, for the SAM.
Step 2: calculate the market from the bottom up
The bottom-up method starts from the basic unit of your business: a customer, a sale, an hour of work. You count how many customers you can reach, how many buy, how often and for how much. The market is these elements multiplied together.
The calculation fits on one line: number of potential customers × share who buy × purchases per year × average purchase amount. Each term can be checked: by counting, by talking to customers, by observing a competitor, by testing an offer.
This method takes more work, but it produces a figure you can defend. It suits the SAM and above all the SOM. The most useful thing is to do both calculations and compare them. If the gap between the two is very large, one of your assumptions is probably wrong.
What does the calculation look like for a local business?
For a neighbourhood business, the national total market carries little weight. Your customers come from a limited area, called the catchment area: the territory most of a shop’s customers come from. So the work focuses mainly on the serviceable market and the obtainable market.
This example shows an important point: for a local business, the obtainable market is often limited by your production capacity (your hours, your seats, your floor space) well before it is limited by demand. Always calculate both and keep the smaller one.
And for an app or software product?
An app can be sold anywhere, which makes the total market very large on paper. The risk is stopping there. What limits an app is not the area, it is the cost and time needed to find and convince each customer.
The gap between €8.64 million and €32,400 is not a problem. It shows that the market is far from saturated and that growth will depend on your sales resources. That is useful information for deciding whether, for example, to hire a salesperson or go through a partner who already knows these practitioners.
Where can you find reliable public data in France?
A market study with figures relies on data others can find again. In France, several public or free sources cover most of what a founder needs.
INSEE’s Base permanente des équipements lists the shops, services and facilities open to the public, at municipality level. It tells you, for example, how many bakeries or hair salons already exist in your area. The Projecteurs guides from Bpifrance Création (the start-up guidance service of Bpifrance, the French public investment bank) are each devoted to one trade; they bring together key figures, market research material and economic ratios.
The chambres de commerce et d’industrie (CCI, chambers of commerce and industry) and the chambres de métiers et de l’artisanat (CMA, chambers of trades and crafts) also support new business owners and can point you to local data. Studies from private research firms exist, often paid; ask your town library or your CCI whether you can consult them there. For a very new activity, be aware that official classifications sometimes cover it poorly: field data then takes on a bigger role.
How should you cite your sources?
A figure without a source reads as a guess. For each piece of data in your calculation, state who produced it, the title of the document, the year of the data and, if possible, the link. A footnote or a table of assumptions at the end of your file is enough.
- Published data: “INSEE, population census, data for the municipality, year of the data”.
- Field data: “Survey carried out by the founder, 200 people interviewed in March, outside two of the town’s markets”.
- Assumption: “Cautious assumption, in the absence of published data; to be confirmed by the first months of trading”.
Distinguishing these three categories is already a sign that you are serious. A reader readily accepts an assumption if it is presented as one. They become wary when an assumption is presented as a fact. It is also one of the things a lender looks at, as the guide what a banker looks at in a project explains.
Which mistakes should you avoid when estimating your market size?
The “I only need 1% of the market” trap
This is the most widespread mistake. You take a huge total market, keep 1% of it, and the result looks modest. Yet it rests on nothing: nothing explains why 1% rather than 0.1% or 5%. In the app example, 1% of the serviceable market would mean 240 customers, more than double what the sales capacity allows over three years. The obtainable market is calculated from your resources, not from a percentage you picked.
Confusing the total market with the serviceable market
Presenting a sector’s national market as “your market” when you are opening a single outlet muddies the picture. Show all three levels and say which one your forecasts are based on.
Using old or ill-suited data
Check the year of the data and what it covers: a national figure does not apply as-is to a small town, and a broad sector can lump together activities very different from yours.
Forgetting the competition and customers who will not switch
Some potential customers are already served and happy, others will never pay for this need. Count the competitors in your area and explain what would make a customer come to you rather than to them.
Once these figures are established, they will have their own slide in your presentation; the guide how to structure a pitch deck shows where to put it.
Sources
General information. This guide does not replace advice from a chartered accountant, a lawyer or a bank adviser.